Aggregate (5-minute sampling) Graphs | Aggregate (1-minute sampling) Graphs | Broadcast, Unknown-Unicast, and Multicast (BUM) Graphs
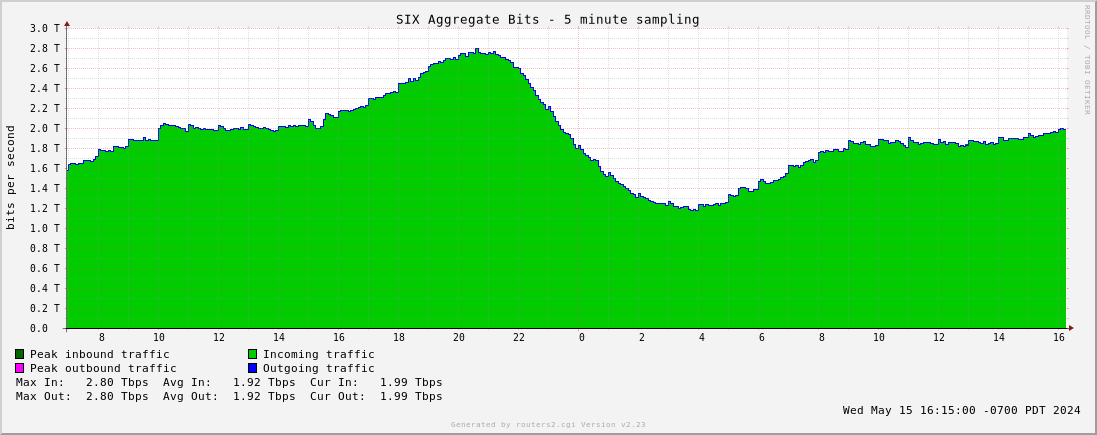
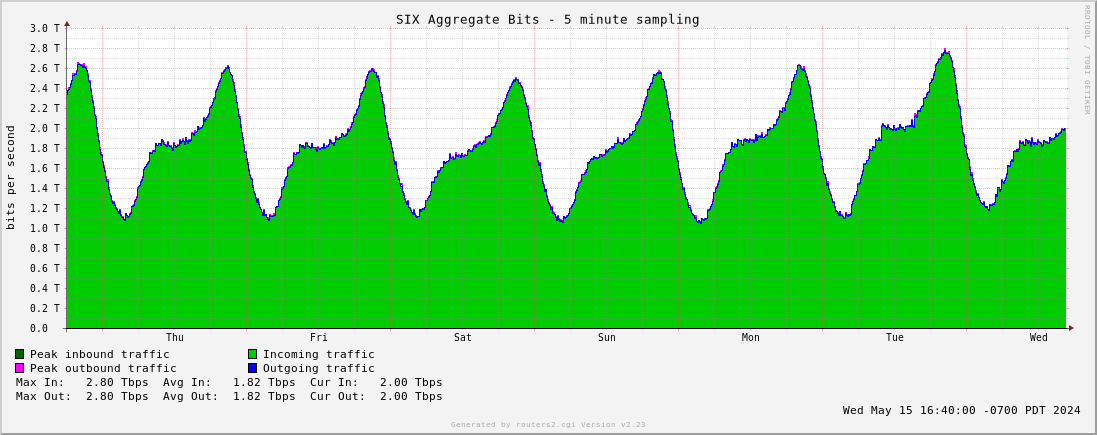
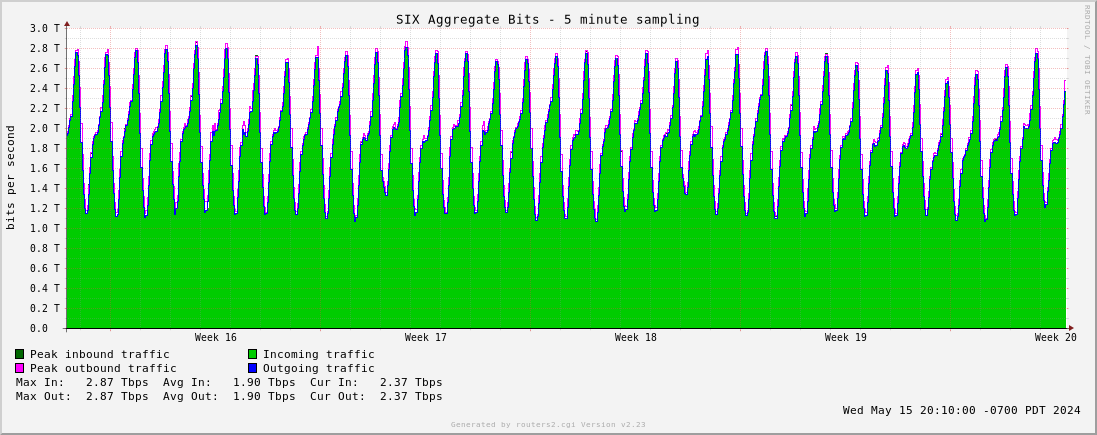
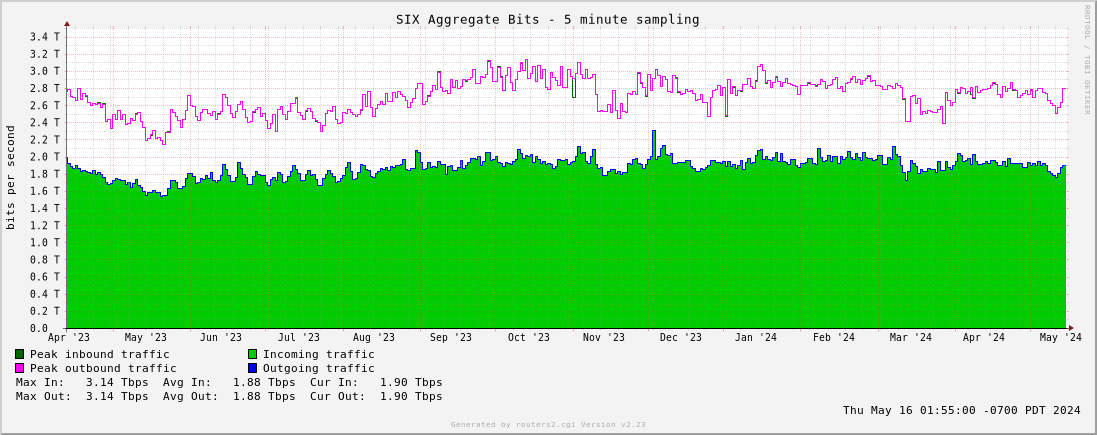
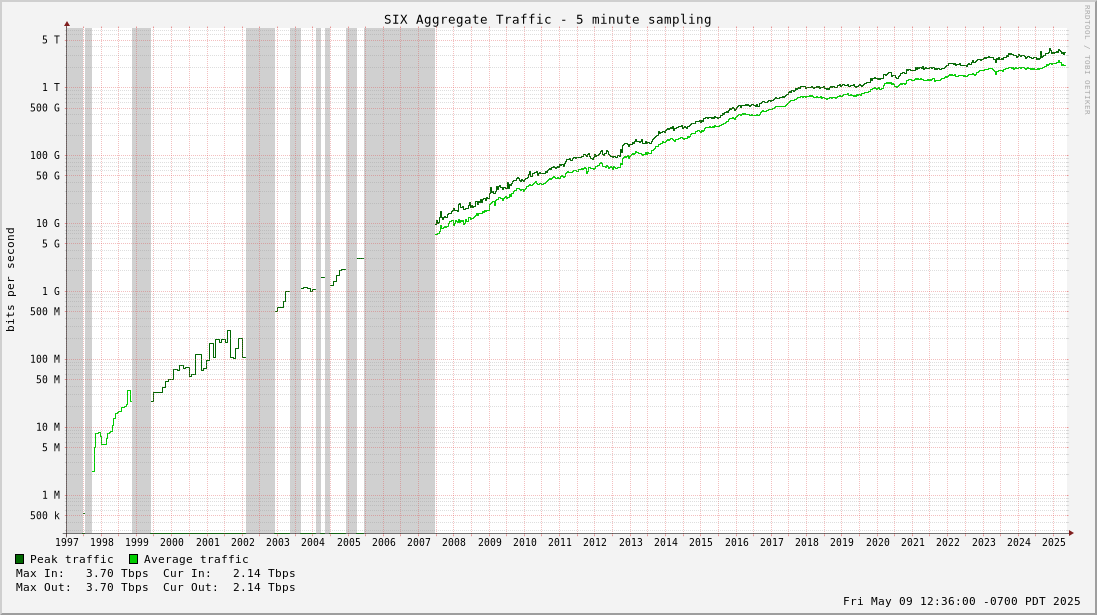
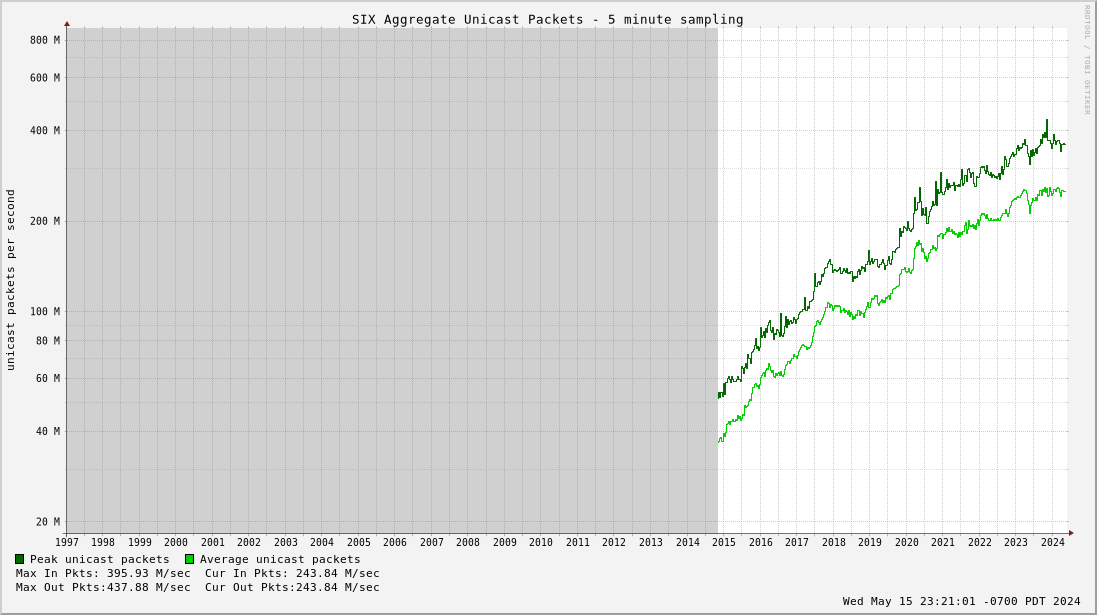
The aggregate bit rate is on the low side because not all extension operators are providing data for their clients.
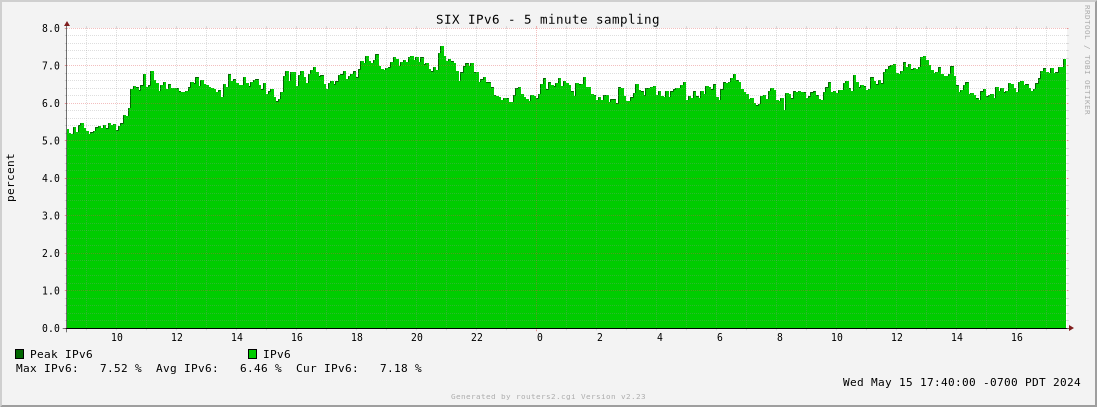
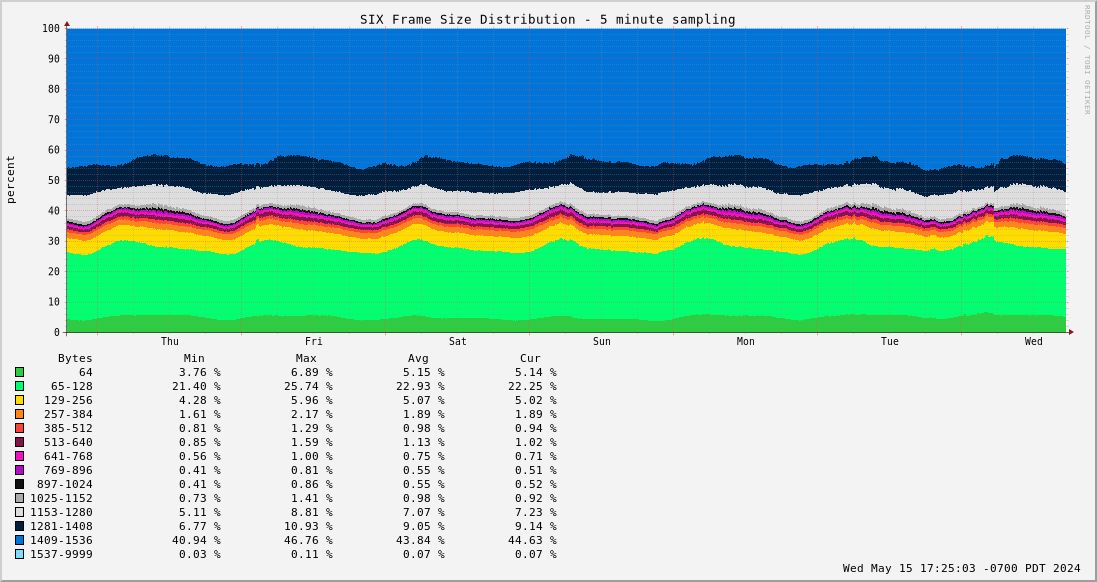
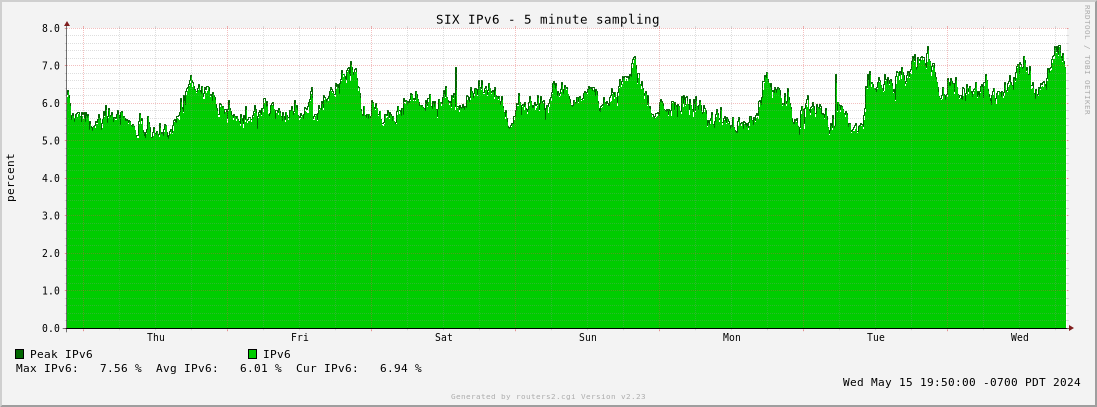
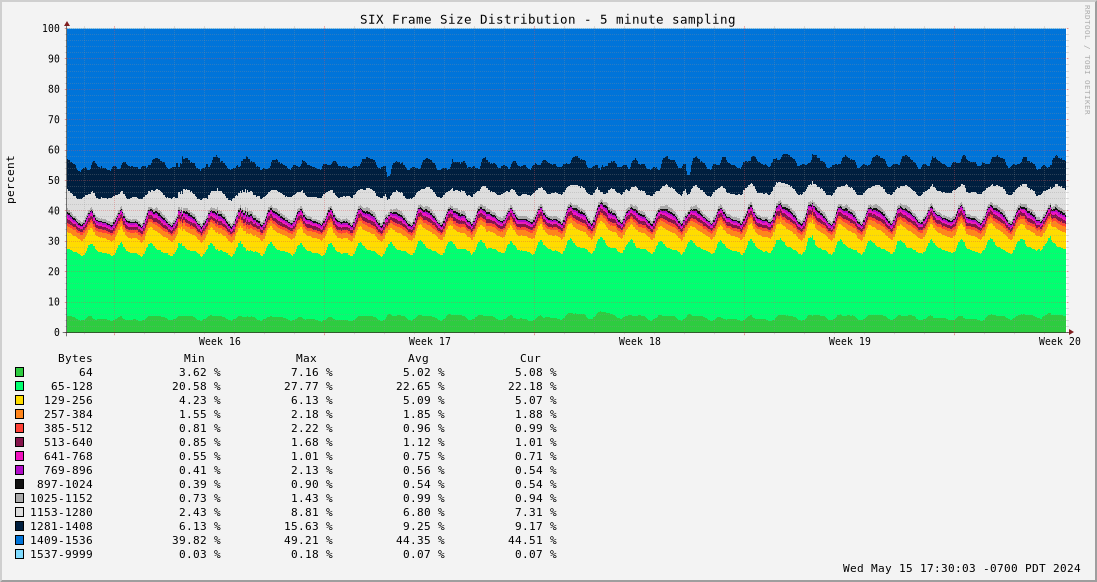
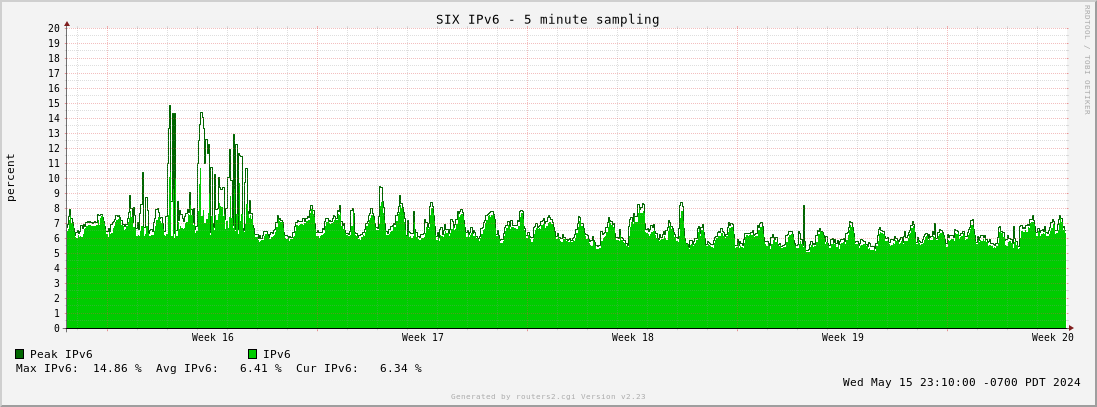
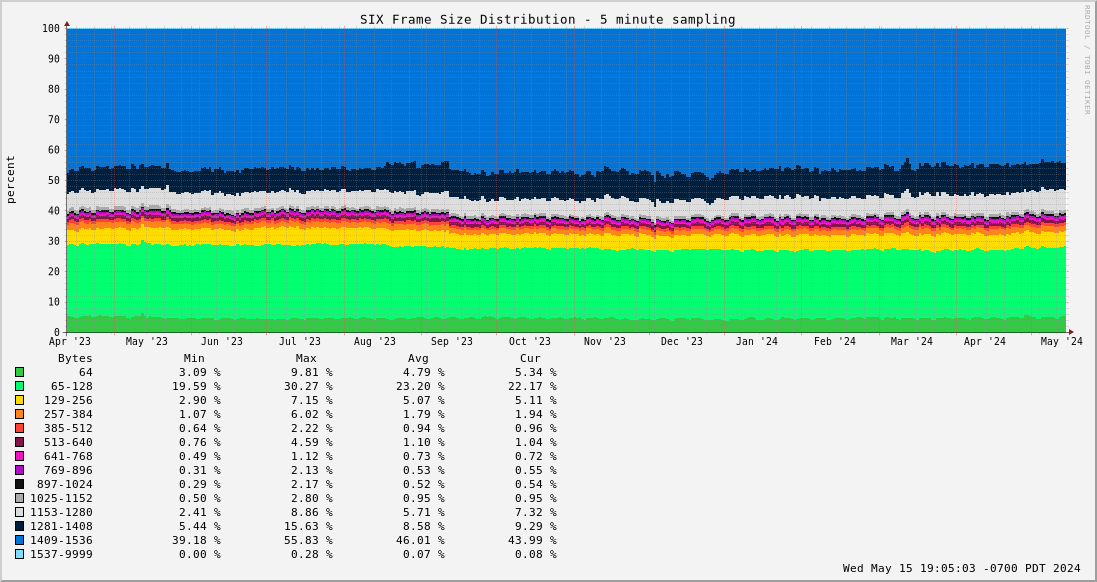
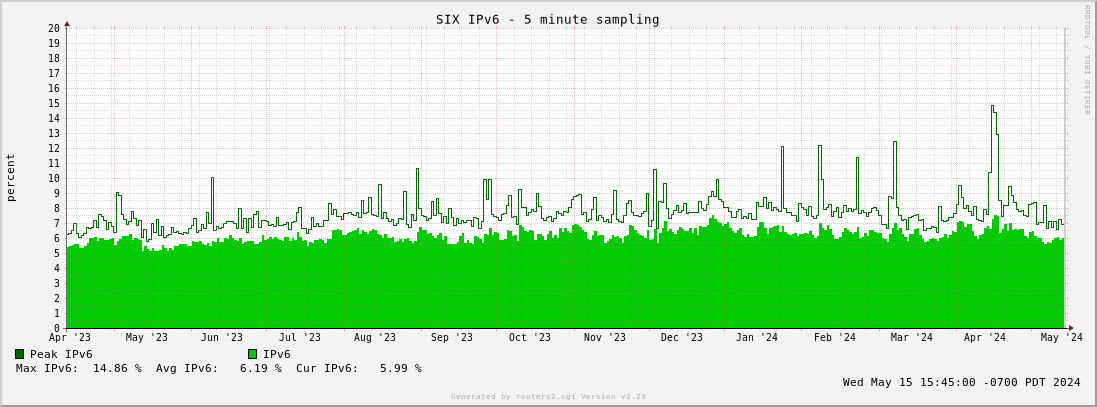
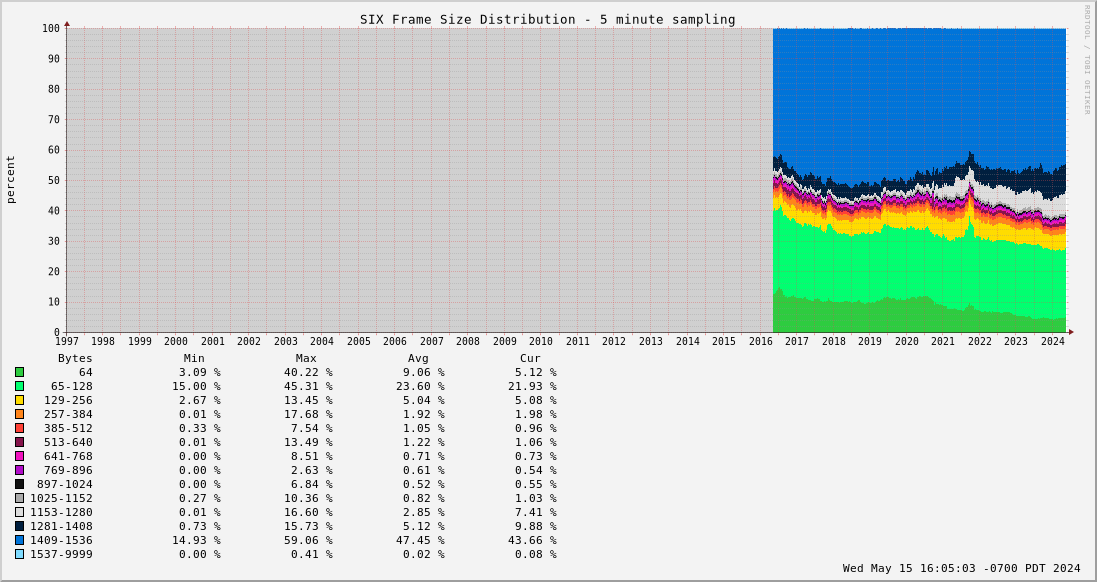
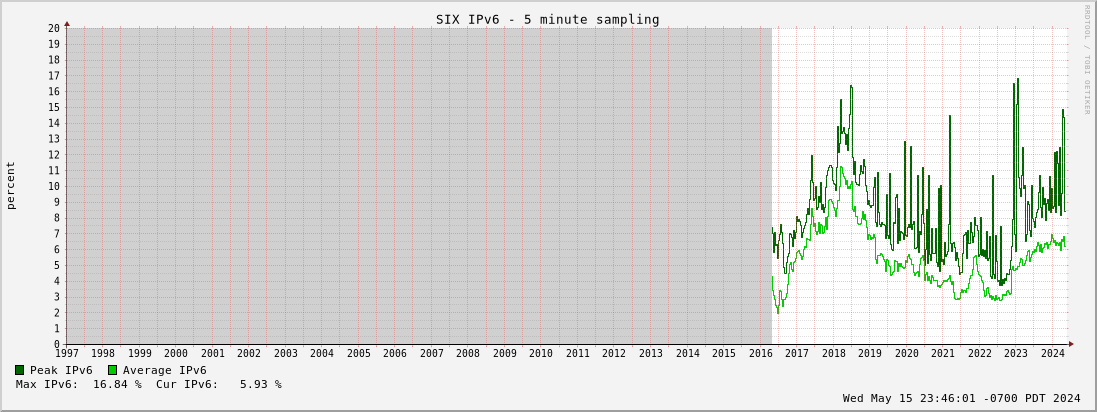
The frame size distribution and IPv6 percentage charts are based on sFlow data from the Arista core switches. 1 out of every 100k frames are sampled for layer-2 (Ethernet) fields. For the IPv6 chart, the percentage indicated is the result of dividing the octet sum of frames with EtherType 0x86dd (IPv6) by the octet sum of frames of all EtherTypes observed.
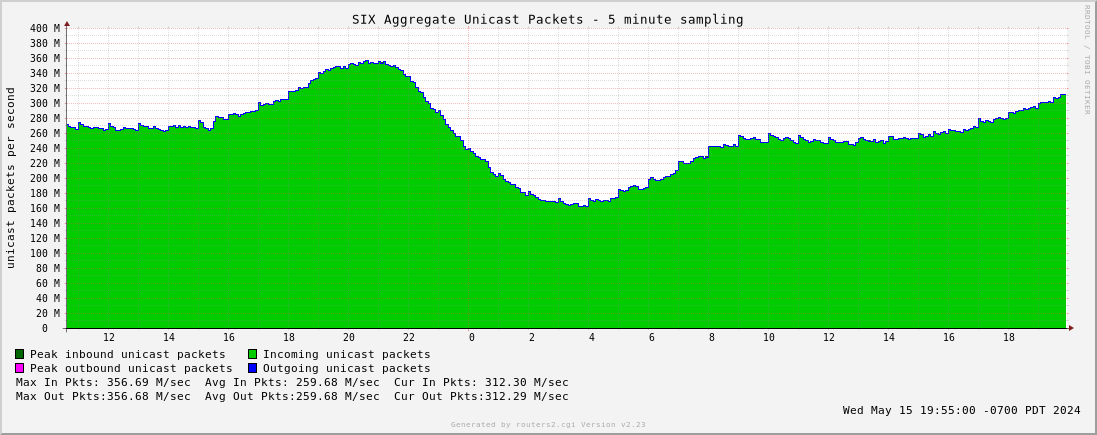
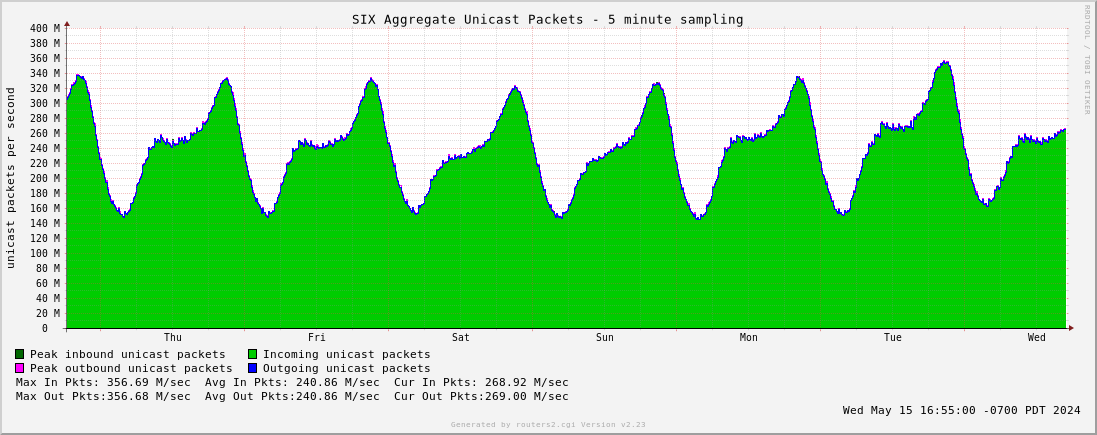
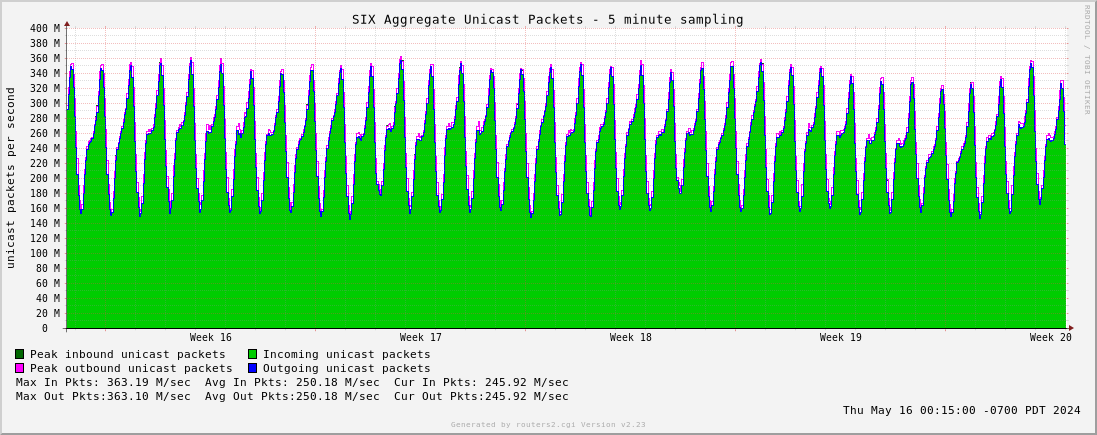
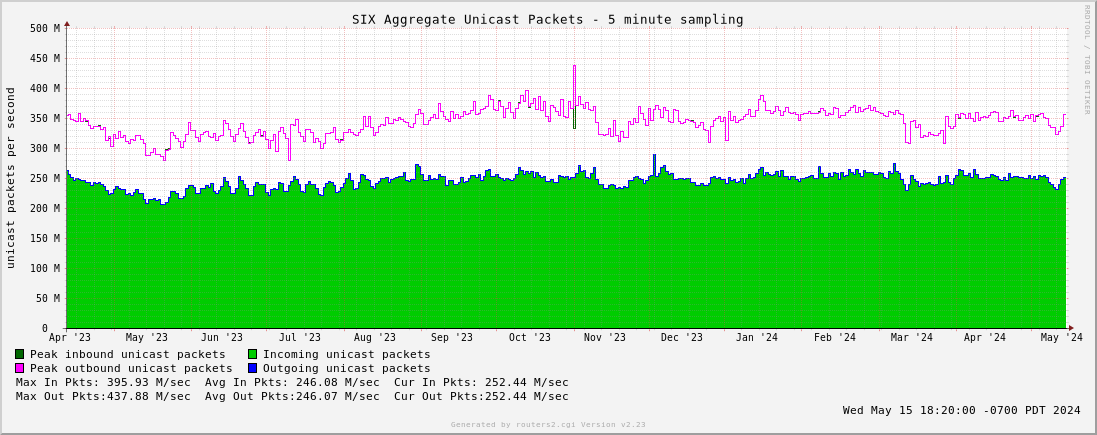
The charts on this page are based on the IX standard 5 minute sampling rate. There is also a page with the charts based on a 1 minute sampling rate.
Daily | Weekly | Monthly | Yearly | Multi-Year | Researchers

Multi-year scale: (data prior to 2007 is approximate)
Researchers:
Raw RRD aggregate files (5 minute sample rate): Bits | Unicast Packets | Frame Size Distribution | IPv4 | IPv6
Text files containing daily average and maximum traffic levels.
Packet Clearing House BCP for exchange points prescribes a graph and a table.
Please acknowledge the Seattle Internet Exchange, as appropriate.
Questions welcome at info_a_t_seattleix.net.